Using the local web interface
To connect to the IX15 local Web UI:
- Use an Ethernet cable to connect the IX15's ETH port to a laptop or PC.
- Open a browser and go to 192.168.2.1.
- Log into the device using a configured user name and password.
The default user name is admin and the default password is the unique password printed on the label packaged with your device.
Review the dashboard
After logging in, the local web admin dashboard is displayed.
The dashboard shows the current state of the device.
| Dashboard area | Description |
|---|---|
| Network activity |
|
| Digi Remote Manager |
Displays the device connection status for Digi Remote Manager, the amount of time the connection has been up, and the Digi Remote Manager device ID. See Using Digi Remote Manager. The links in this section enable you to do the following:
|
| Device |
Displays the IX15 device's status, statistics, and identifying information. |
| Serial Ports |
Displays information about the serial ports on the IX15. Each serial port is identified by port name or number, followed by the serial port mode configured for the port. The icons next to the port name or number shows the serial port status:
You can click the icons at the top of the section to access other pages:
|
| Services |
Displays an option for the Watchdog service if it has been enabled. |
|
XBee Network |
Shows the XBee network status and information such as the protocol, network identifier, or the number of nodes. |
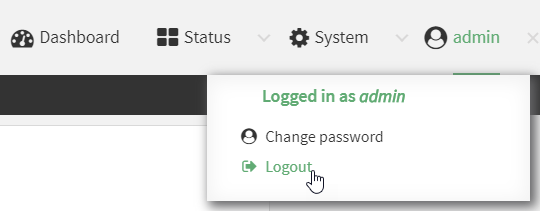
- On the main menu, click your user name. Click Log out.
 PDF
PDF


