Display a data stream in chart or tabular format
You can display data points for a selected data stream in table or chart format. You can also configure the time line and the type of data displayed, and save or export the data.
-
From the main menu, click Insights > Data Streams.
- Click the Stream ID, or select the appropriate data stream and click .
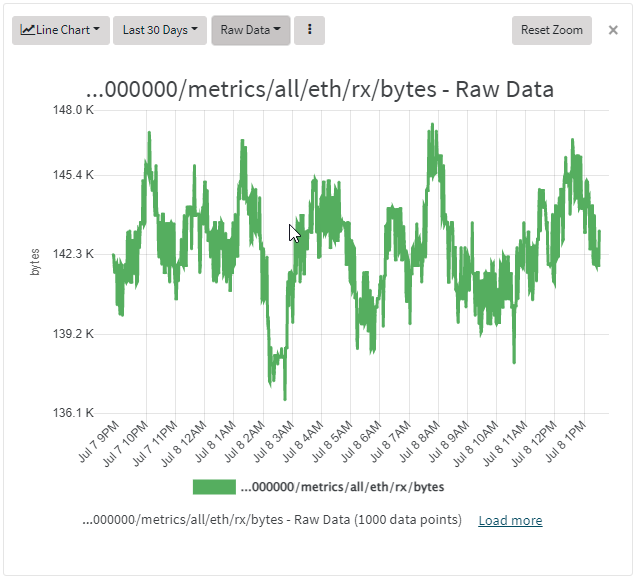
The data stream is displayed in chart format:
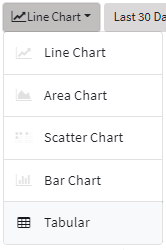
Change the chart type
To change the type of chart that is used to display the data stream:
-
Click the Chart menu
- Select the appropriate type of chart.
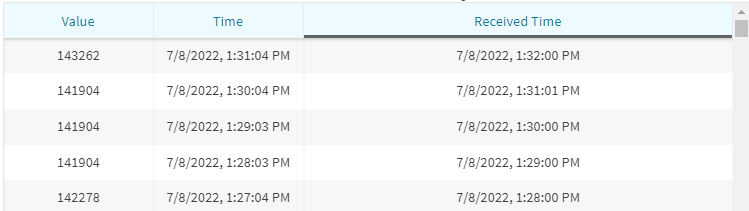
Display the data stream in tabular format
To display the data stream in tabular format, listing each individual data point:
-
Click the Chart menu.
-
Select Tabular.
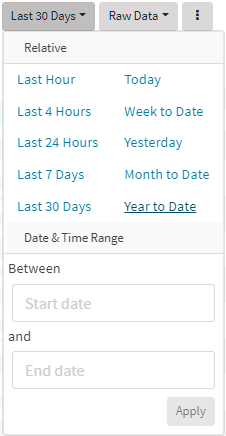
Change the time line for the chart
To change the time line displayed by the chart or table:
-
Click the Time line menu.
-
Click a relative timeline, or select the date and time range.
-
Click Apply.
Change the type of data being displayed
To change the type of data being displayed:
-
Click the Data menu.
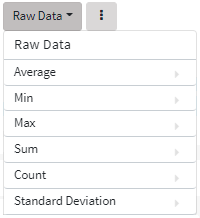
-
Select the appropriate type of data to be displayed.
Edit the chart
You can change the chart title and related chart settings.
-
Click .
-
Select Edit Chart.
-
Change the appropriate chart options.
-
Click Apply.
Zoom in and out in chart view
When viewing a data stream in a chart, you can zoom in and out of the data by using the mouse wheel. Click Reset Zoom to return to the original display.
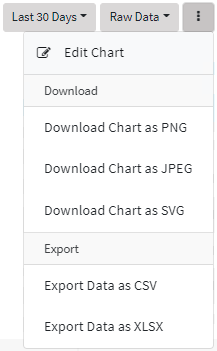
Download the chart or export data
You can download the data stream chart as a PNG, JPEG, or SVG, and you can export the chart's data in CSV or Excel formats.
-
Click .
-
To download the chart, select the appropriate filetype to download.
-
To export the data used to create the chart in CSV or XLSX formats, select the appropriate filetype to export to.
-
The chart or file will be downloaded using your browser's download functionality.
 PDF
PDF


